Prevalence and position tell different stories. A category appearing across more tracked results does not mean it gained the same share of measured positions within those results.
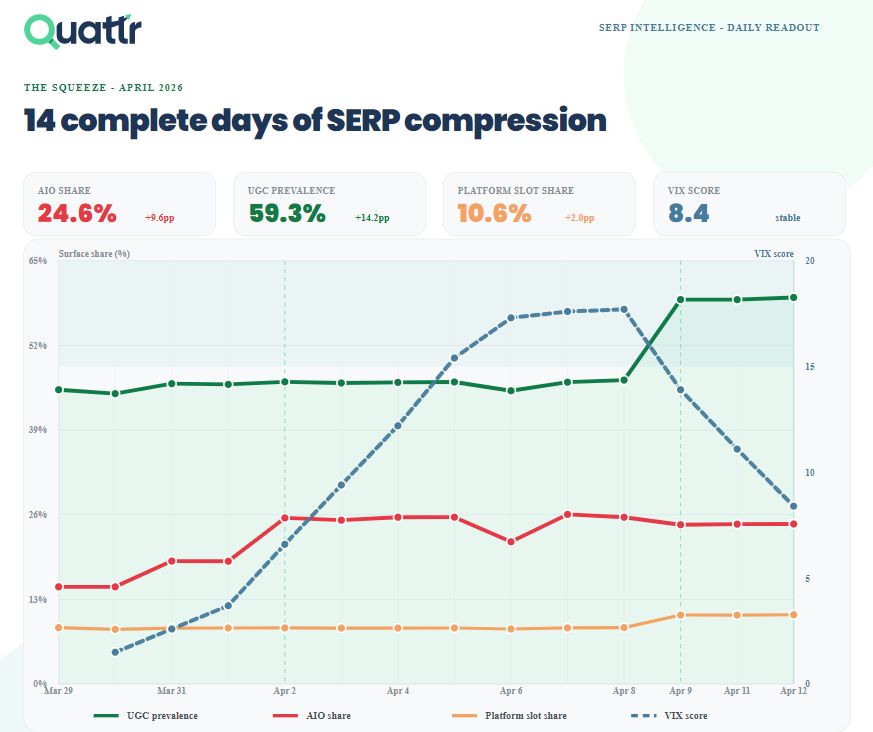
Key figures in text
| Measure | Value |
|---|---|
| AIO share: final readout | 24.6% |
| UGC prevalence: final readout | 59.3% |
| Platform slot share: final readout | 10.6% |
| VIX score: final readout | 8.4 index score |
A broader footprint can coexist with modest slot movement
The final readout reports AIO share at 24.6%, UGC prevalence at 59.3% and platform slot share at 10.6%. The platform-slot series moves much less than the prevalence series over this window.
Use presence to ask whether a feature appears in a tracked result. Use prevalence to describe how widely the recorded category appears in the sample. Use slot share to ask how many of the measured positions it occupies. The definitions and denominators must travel with the numbers.
A quieter index does not restore an earlier result mix
The VIX line rises and then falls to 8.4 while the composition series finish at different levels from their starting positions. That makes the relationship worth investigating: lower volatility need not mean the earlier result mix has returned.
The original interpretation suggested that a new structure was settling in. I would track whether that pattern persists across later observations.
Match the response to the measure
A business should inspect the queries and destinations underneath the readout before deciding whether it faces a ranking problem, a changing result surface or both.
- Report presence, prevalence and position share separately.
- Keep a volatility index on its own scale.
- Compare a consistent sample over a longer window.
- Connect the observed result mix to useful destination experiences and business outcomes.
Appearing more often and occupying more positions are different opportunities.
Source & measurement notes
Original user-supplied Quattr daily readout, with a March 29–April 12 plotted window and an April 2026 heading. The accompanying analysis describes AIO presence among tracked queries. Presence, UGC prevalence, platform slot share and the proprietary VIX score are distinct measures; VIX uses the right-hand axis. The complete query basket, market/device weights, slot-counting rules and VIX calculation are not documented in the retained graphic. The archive associates this image with April 13, but its text mapping is inconsistent, so an exact post date and permalink are not asserted.